Text format
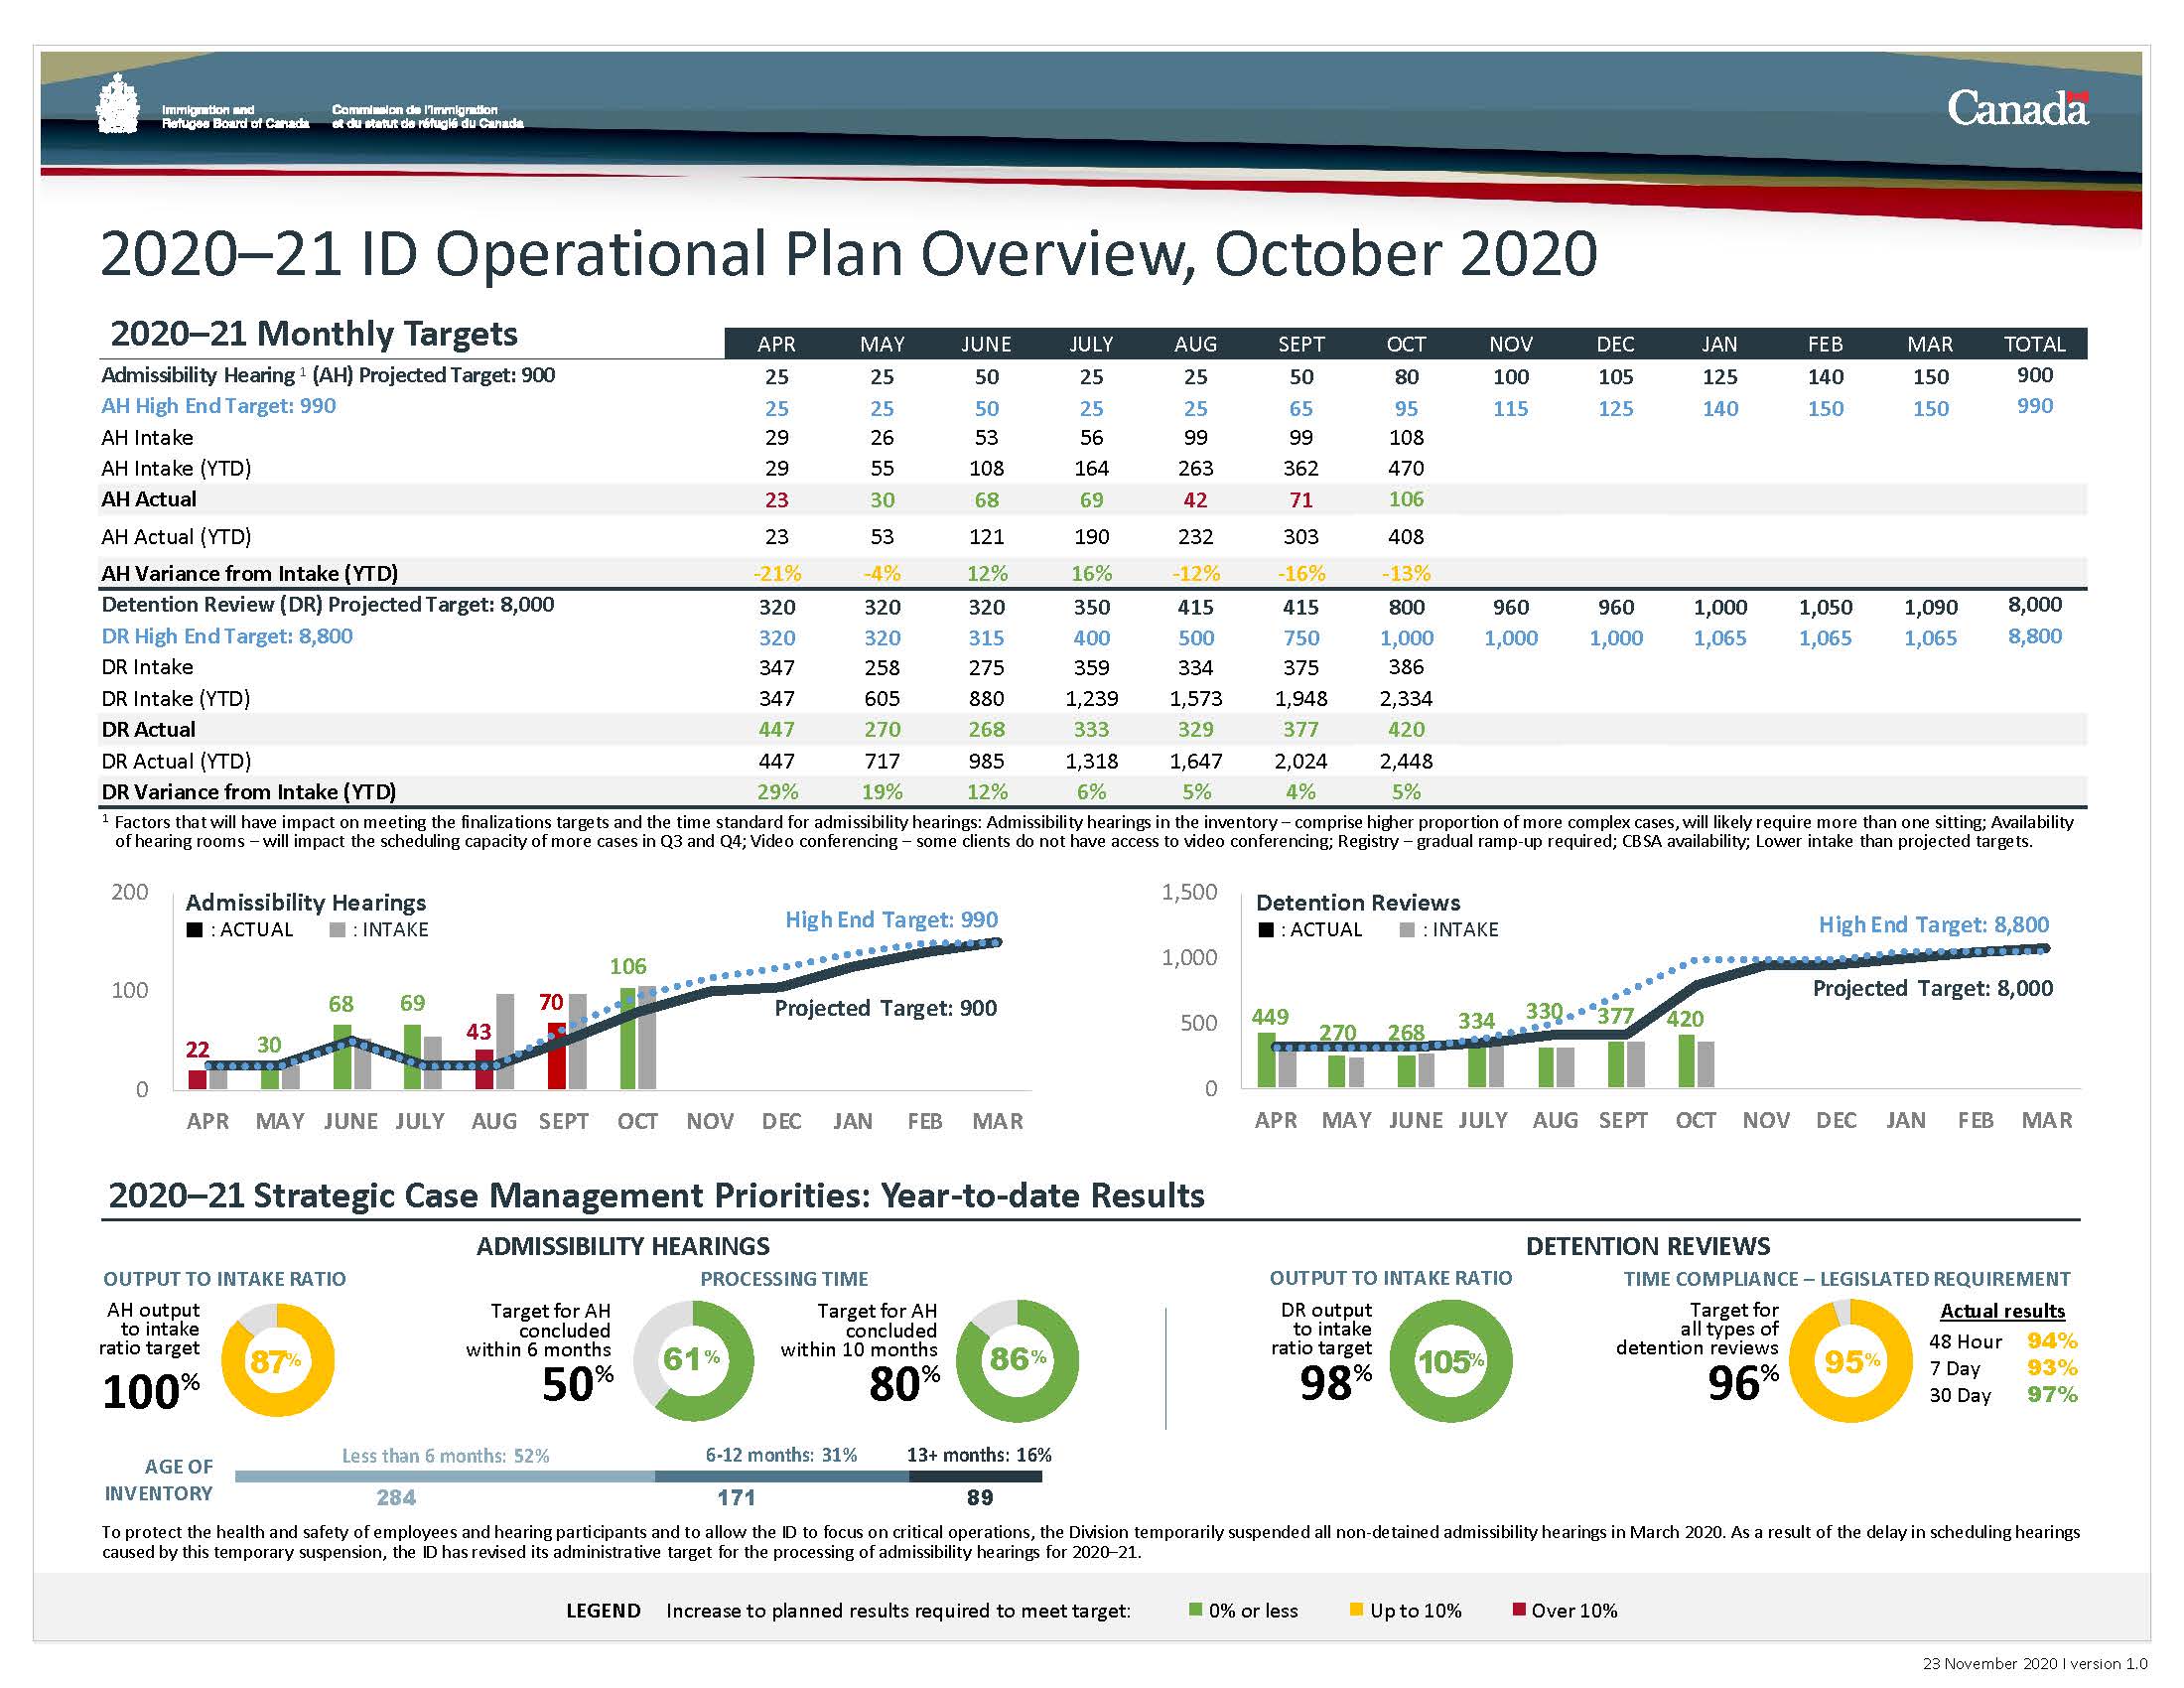
2020–21 monthly targets
| 2020-21 monthly targets | Apr | May | June | July | Aug | Sept | Oct | Nov | Dec | Jan | Feb | Mar | Total |
|---|
| Admissibility hearing* (AH) projected target: 900 | 25 | 25 | 50 | 25 | 25 | 50 | 80 | 100 | 105 | 125 | 140 | 150 | 900 |
| AH high end target: 990 | 25 | 25 | 50 | 25 | 25 | 65 | 95 | 115 | 125 | 140 | 150 | 150 | 990 |
| AH intake | 29 | 26 | 53 | 56 | 99 | 99 | 108 | | | | | | |
| AH intake (YTD) | 29 | 55 | 108 | 190 | 232 | 303 | 408 | | | | | | |
| AH actual | 23 | 30 | 68 | 69 | 42 | 71 | 106 | | | | | | |
| AH actual (YTD) | 23 | 53 | 121 | 190 | 232 | 303 | 408 | | | | | | |
| AH variance from intake (YTD) | -21% | -4% | 12% | 16% | -12% | -16% | -13% | | | | | | |
| 2020-21 monthly targets | Apr | May | June | July | Aug | Sept | Oct | Nov | Dec | Jan | Feb | Mar | Total |
|---|
| Detention Review (DR) projected target: 8,000 | 320 | 320 | 320 | 350 | 415 | 415 | 800 | 960 | 960 | 1,000 | 1,050 | 1,090 | 8,000 |
| DR high end target: 8,800 | 320 | 320 | 315 | 400 | 500 | 750 | 1,000 | 1,000 | 1,000 | 1,065 | 1,065 | 1,065 | 8,800 |
| DR intake | 347 | 258 | 275 | 359 | 334 | 375 | 386 | | | | | | |
| DR intake (YTD) | 347 | 605 | 880 | 1,239 | 1,573 | 1,948 | 2,334 | | | | | | |
| DR actual | 447 | 270 | 268 | 333 | 329 | 377 | 420 | | | | | | |
| DR actual (YTD) | 447 | 717 | 985 | 1,318 | 1,647 | 2,024 | 2,448 | | | | | | |
| DR variance from intake (YTD) | 29% | 19% | 12% | 6% | 5% | 4% | 5% | | | | | | |
* Factors that will have impact on meeting the finalizations targets and the time standard for admissibility hearings: Admissibility hearings in the inventory – comprise higher proportion of more complex cases, will likely require more than one sitting; Availability of hearing rooms – will impact the scheduling capacity of more cases in Q3 and Q4; Video conferencing – some clients do not have access to video conferencing; Registry – gradual ramp-up required; CBSA availability; Lower intake than projected targets.
2020–21 strategic case management priorities: year-to-date results
Admissibility hearings
Output to intake ratio
| Output to intake ratio | 87% | 13% |
|---|
| Target: 100% AH output to intake ratio |
Processing time
| Concluded within 6 months | 61% | 39% |
|---|
| Target: 50% of AH concluded within 6 months |
| Concluded within 10 months | 86% | 14% |
|---|
| Target: 80% of AH concluded within 10 months |
Age of inventory
| Less than 6 months | 6-12 months | 13+ months |
|---|
| Number of cases | 284 (52%) | 171 (31%) | 89 (16%) |
Detention reviews
Output to intake ratio
| Output to intake ratio | 105% | 0% |
|---|
| Target: 98% DR output to intake ratio |
Time compliance – legislated requirement
| Overall | 95% | 5% |
| Actual results: 48 hours | 94% | 6% |
| Actual results: 7 day | 93% | 7% |
| Actual results: 30 day | 97% | 3% |
| Target: 96% for all types of detention reviews |
To protect the health and safety of employees and hearing participants and to allow the ID to focus on critical operations, the Division temporarily suspended all non-detained admissibility hearings in March 2020. As a result of the delay in scheduling hearings caused by this temporary suspension, the ID has revised its administrative target for the processing of admissibility hearings for 2020–21.
Legend
| | Green | Yellow | Red |
|---|
| Increase to planned results required to meet target | 0% or less | Up to 10% | Over 10% |