Text format
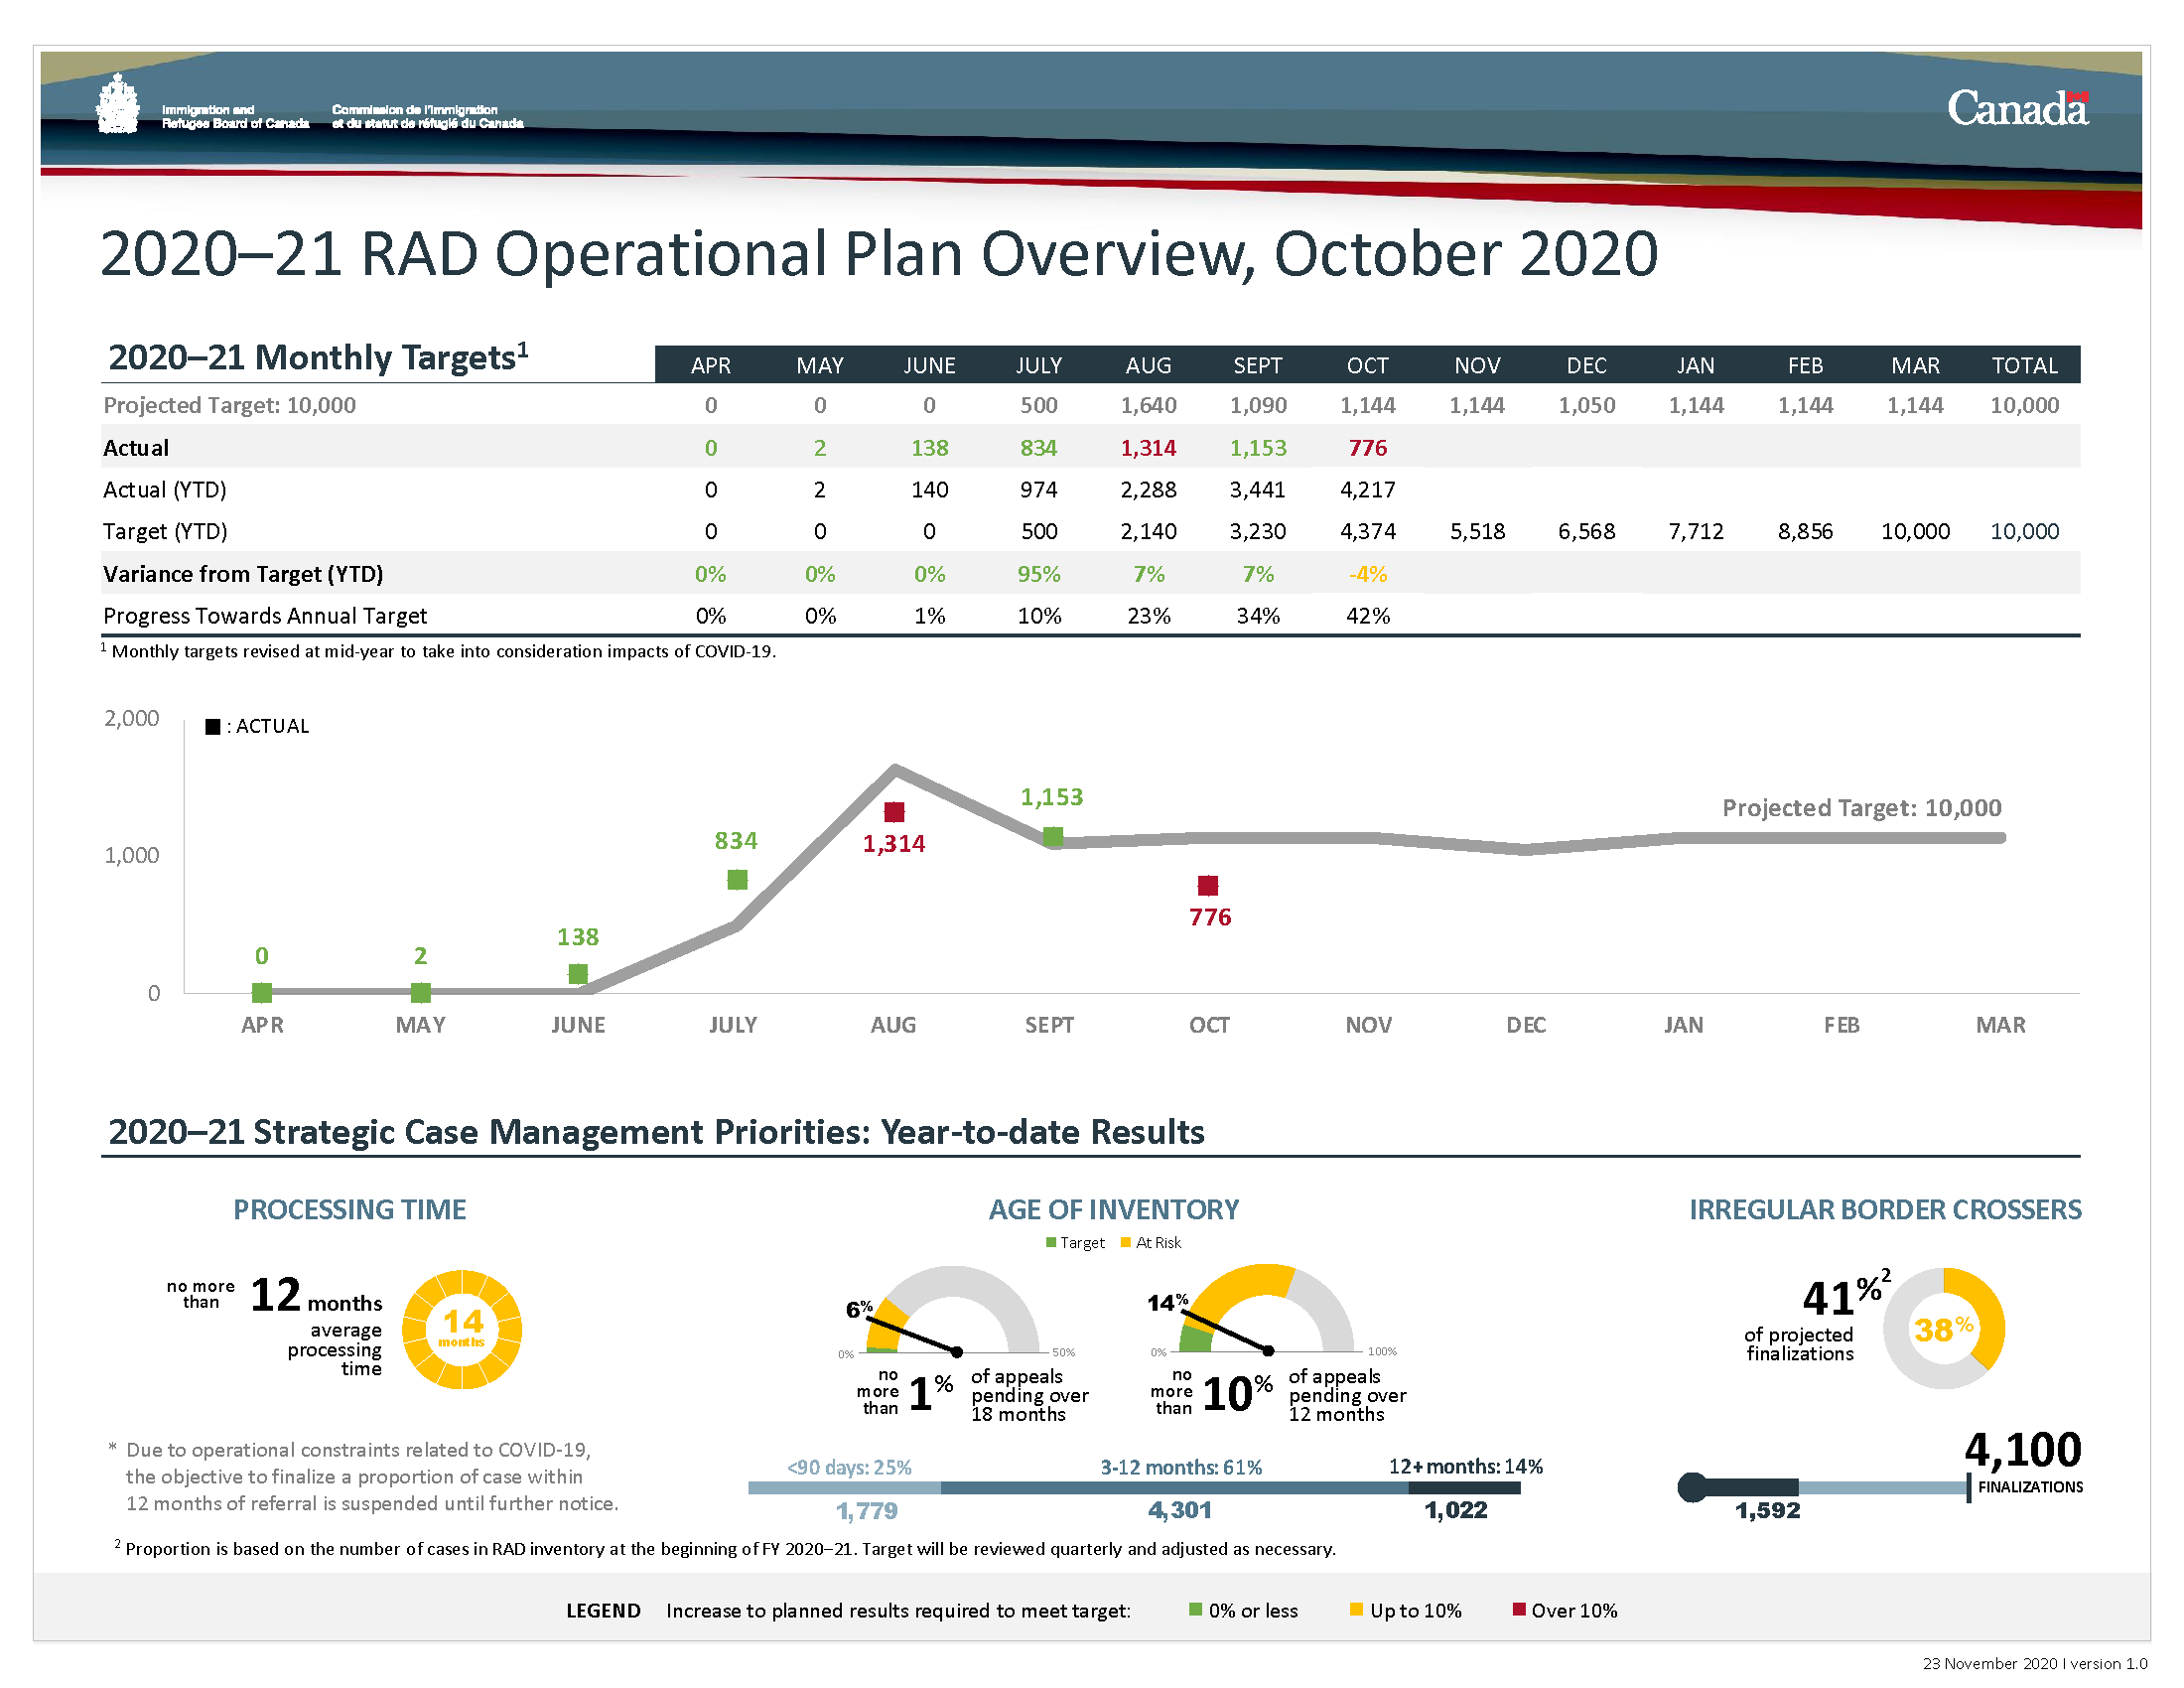
2020-21 monthly targets
| 2020-21 monthly targets* | Apr | May | June | July | Aug | Sept | Oct | Nov | Dec | Jan | Feb | Mar | Total |
|---|
| Projected Target: 10,000 | 0 | 0 | 0 | 500 | 1,640 | 1,090 | 1,144 | 1,144 | 1,050 | 1,144 | 1,144 | 1,144 | 10,000 |
| Actual | 0 | 2 | 138 | 834 | 1,314 | 2,153 | 776 | | | | | | |
| Actual (YTD) | 0 | 2 | 140 | 974 | 2,288 | 3,441 | 4,217 | | | | | | |
| Target (YTD) | 0 | 0 | 0 | 500 | 2,140 | 3,230 | 4,374 | 5,518 | 6,568 | 7,712 | 8,856 | 10,000 | 10,000 |
| Variance from target (YTD) | 0% | 0% | 0% | 95% | 7% | 7% | -4% | | | | | | |
| Progress towards annual target | 0% | 0% | 1% | 10% | 23% | 34% | 42% | | | | | | |
* Monthly targets revised at mid-year to take into consideration impacts of COVID-19.
2020–21 strategic case management priorities: year-to-date results
Processing time*
| Average processing time maintained within 12 months | 14 months |
|---|
| Target: no more than 12 months average processing time |
*Due to the operational constraints related to COVID-19, the objective to finalize a proportion of the case within 12 months of referral is suspended until further notice.
Age of inventory
| Cases currently over 18 months | Cases at risk of 18 months by end of FY 2020-21 |
|---|
| Claims pending over 18 months | 6% | 11% |
| Target: no more than 1% of appeals pending over 18 months |
| Cases currently over 12 months | Cases at risk of 12 months by end of FY 2020-21 |
|---|
| Appeals pending over 12 months | 14% | 60% |
| Target: no more than 10% of appeals pending over 12 months |
| <90 days | 3-12 months | 12+ months |
|---|
| Number of cases | 1,779 (25%) | 4,301 (61%) | 1,022 (14%) |
Irregular border crossers (IBC)
| Year-to-date proportion of IBC finalizations | 38% | 62% |
|---|
| Target: 41%* of IBC finalizations from projected total finalizations |
* Proportion is based on the proportion of cases in RAD inventory at the beginning of FY 2020-21. Target will be reviewed quarterly and adjusted as necessary.
| Year-to-date IBC finalizations | 1,592 |
|---|
| Target: 4,100 finalizations by the end of fiscal year |
Legend
| Green | Yellow | Red |
|---|
| Increase to planned results required to meet target | 0% or less | Up to 10% | Over 10% |